A previous blogpost introduced a methodology to measure the usage of JavaScript APIs on the web by crawling the web. The starting point of our web crawling research is the work of Peter Snyder. Most importantly, we wanted to compare the differences in JS API usage between browsers with and without privacy extension (e.g., uBlock Origin). We have finished the development of the crawling tool. We crawled thousands of websites and collected JavaScript calls on the visited web pages.
This blog post introduces the methodology and results of the crawling.
Introduction
When a user opens a webpage in a JavaScript-enabled web browser, that webpage can access various APIs supported by the web browser. The webpage can read, for example, the value of performance.now(), battery status or data from sensors (when available). All these values can be misused to create a device fingerprint that can be used to identify the user.
We aim to research how JS APIs are used on websites. The main research questions are: * What APIs do websites use? * How many APIs does a website use? * What endpoints do websites access most often? * How many JS calls are made? * What are the differences in results in all the previous questions with an active privacy web-browser extension (e.g., uBlock Origin)? For example, What JS calls are blocked by uBlock Origin?
The answers to these questions should help us better understand websites' behaviour. Based on the obtained data, we want to define the suspicious behaviour indicating that the website is trying to fingerprint the user's device.
We plan to keep the anti-fingerprint mechanism updated based on derived heuristics. The heuristics are derived from the following statistics:
- How many APIs and endpoints does the website access?
- How many JS calls did the website make?
- Is the number and combination of JS APIs calls suspicious?
When our anti-fingerprint mechanism detects suspicious combinations or a high number of used APIs, it can block communication with the webpage.
Crawler
We have developed Web crawler - a tool for automatically visiting websites from a given list and collecting JavaScript calls made by the website. Our Web crawler is based on the OpenWPM platform. A modified web browser extension Web API Manager collects statistics on called JS APIs.
The crawling process can be described in the following steps:
- The python script
start_docker_runs.pylaunches the Docker image martan305/web_crawler. The parameters set in the Python startup script are given to the Docker container as environmental variables. - If a privacy extension is required (in the script parameter), uBlock Origin will be installed as soon as the web browser is started.
- Python script running in the container visits web pages from a given list one by one.
- The browser waits for 30 seconds on each page. The customised web browser extension Web API Manager intercepts JS calls and stores the stats into the SQLite database.
- When the script finishes the crawl of assigned pages, it checks if there is a batch of pages not yet visited. If there is an unprocessed batch, the crawling continues with step 3 and the new list of web pages to visit. If the crawler visited all sites, the crawling ends.
For now, we only visited the homepages because we wanted to visit as many different websites as possible. In the future, we plan to launch long-term crawling, which will include subpages. In particular, we want to focus on visiting login pages, where we expect fingerprint scripts to be included. Then, we can compare API calls on login pages and other pages.
Afterwards, we analyse the collected data with a standalone analysis tool. The analysis process consists of the following steps:
- Databases created by browsing with and without the web-browser extension uBlock Origin are loaded separately.
- Aggregation SQL queries are executed in databases. The results are loaded into Python dictionaries.
- Data sets are analysed, compared and the results are exported to CSV files.
Measurement results
This section presents the results of the analysis.
We tried to visit the first 250 000 websites from the Tranco list X79N. 211 843 homepages of websites from the Tranco list were successfully visited in both modes - with and without uBlock Origin. More than 4 000 000 000 JS calls were intercepted and stored into 5 000 SQLite databases that have a total size of over 880 GB.
Let us focus on the answers to the research questions on JavaScript API calls made by the websites. This blog post usually lists only 10 result lines for each experiment. Complete tables with all rows can be found in the results stored on the server.
The meaning of the table columns: * Endpoint = a function or a property provided by a web browser. * API = a group of functions and properties that are thematically related. * Website = URL of the visited website. * Calls without uBlock Origin = the number of JavaScript calls intercepted without the uBlock Origin extension. * Calls with uBlock Origin = the number of JavaScript calls intercepted with the uBlock Origin extension. * Difference = the difference between the number of JavaScript calls intercepted with and without the uBlock Origin extension. * Difference [%] = the difference expressed as a percentage. Difference [%] = 100 * Difference/Calls without uBlock Origin * Websites without uBlock [%] - what percentage of websites use the given API (measured without the uBlock Origin extension installed). * Websites with uBlock [%] - what percentage of websites use the given API (measured with the uBlock Origin extension installed).
All result tables are sorted by the Difference [%] column decreasing.
The most blocked API
| API | Calls without uBlock | Calls with uBlock | Difference | Difference [%] |
|---|---|---|---|---|
| Non-Standard | 340 777 | 18 180 | 322 597 | 94,67% |
| Web Audio API | 14 390 507 | 1 431 286 | 12 959 221 | 90,05% |
| Web Speech API | 93 889 | 10 712 | 83 177 | 88,59% |
| Background Tasks API | 5 950 947 | 954 740 | 4 996 207 | 83,96% |
| High Resolution Time (Level 2) | 367 400 369 | 63 507 434 | 303 892 935 | 82,71% |
| Navigation Timing | 8 160 | 1 749 | 6 411 | 78,57% |
| CSS Animations Level 1 | 1 301 | 317 | 984 | 75,63% |
| Beacon | 223 209 | 62 651 | 160 558 | 71,93% |
| DOM Level 2: Traversal and Range | 25 814 025 | 7 996 500 | 17 817 525 | 69,02% |
| Indexed Database API | 1 308 464 | 408 983 | 899 481 | 68,74% |
The most blocked API endpoints
| Endpoint | API | Calls without uBlock | Calls with uBlock | Difference | Difference [%] |
|---|---|---|---|---|---|
| Range.prototype.cloneContents | DOM Level 2: Traversal and Range | 2 603 | 16 | 2 587 | 99,39% |
| Range.prototype.setStartAfter | DOM Level 2: Traversal and Range | 1 234 | 9 | 1 225 | 99,27% |
| MessagePort.prototype.close | HTML: Channel Messaging | 51 802 | 416 | 51 386 | 99,20% |
| SubtleCrypto.prototype.deriveBits | Web Cryptography API | 208 | 2 | 206 | 99,04% |
| Range.prototype.selectNode | DOM Level 2: Traversal and Range | 337 795 | 7 384 | 330 411 | 97,81% |
| Range.prototype.getBoundingClientRect | DOM Level 2: Traversal and Range | 337 650 | 7 565 | 330 085 | 97,76% |
| Document.prototype.close | HTML: Dynamic Markup Insertion | 21 666 | 666 | 21 000 | 96,93% |
| Navigator.prototype.javaEnabled | Non-Standard | 334 580 | 11 781 | 322 799 | 96,48% |
| ServiceWorkerContainer.prototype.getRegistration | Service Workers | 34 176 | 1 375 | 32 801 | 95,98% |
| FormData.prototype.append | XMLHttpRequest | 670 137 | 27 767 | 642 370 | 95,86% |
Use of APIs on websites
| API | Websites without uBlock [%] | Websites with uBlock [%] | Difference [%] |
|---|---|---|---|
| Non-Standard | 62,06% | 4,80% | 57,29% |
| Web Cryptography API | 61,40% | 21,98% | 39,56% |
| Beacon | 32,91% | 7,60% | 25,36% |
| XMLHttpRequest | 71,53% | 47,76% | 24,08% |
| HTML: Channel Messaging | 45,58% | 24,71% | 21,03% |
| Performance Timeline | 41,15% | 21,22% | 20,06% |
| High Resolution Time (Level 2) | 57,37% | 39,24% | 18,39% |
| HTML 5 | 50,14% | 33,45% | 16,91% |
| HTML: Web Storage | 65,69% | 49,48% | 16,53% |
| URL | 29,73% | 15,79% | 14,05% |
| Web Speech API | 14,41% | 0,81% | 13,61% |
| Background Tasks API | 22,23% | 9,40% | 12,89% |
| HTML: Canvas Element | 42,54% | 29,89% | 12,85% |
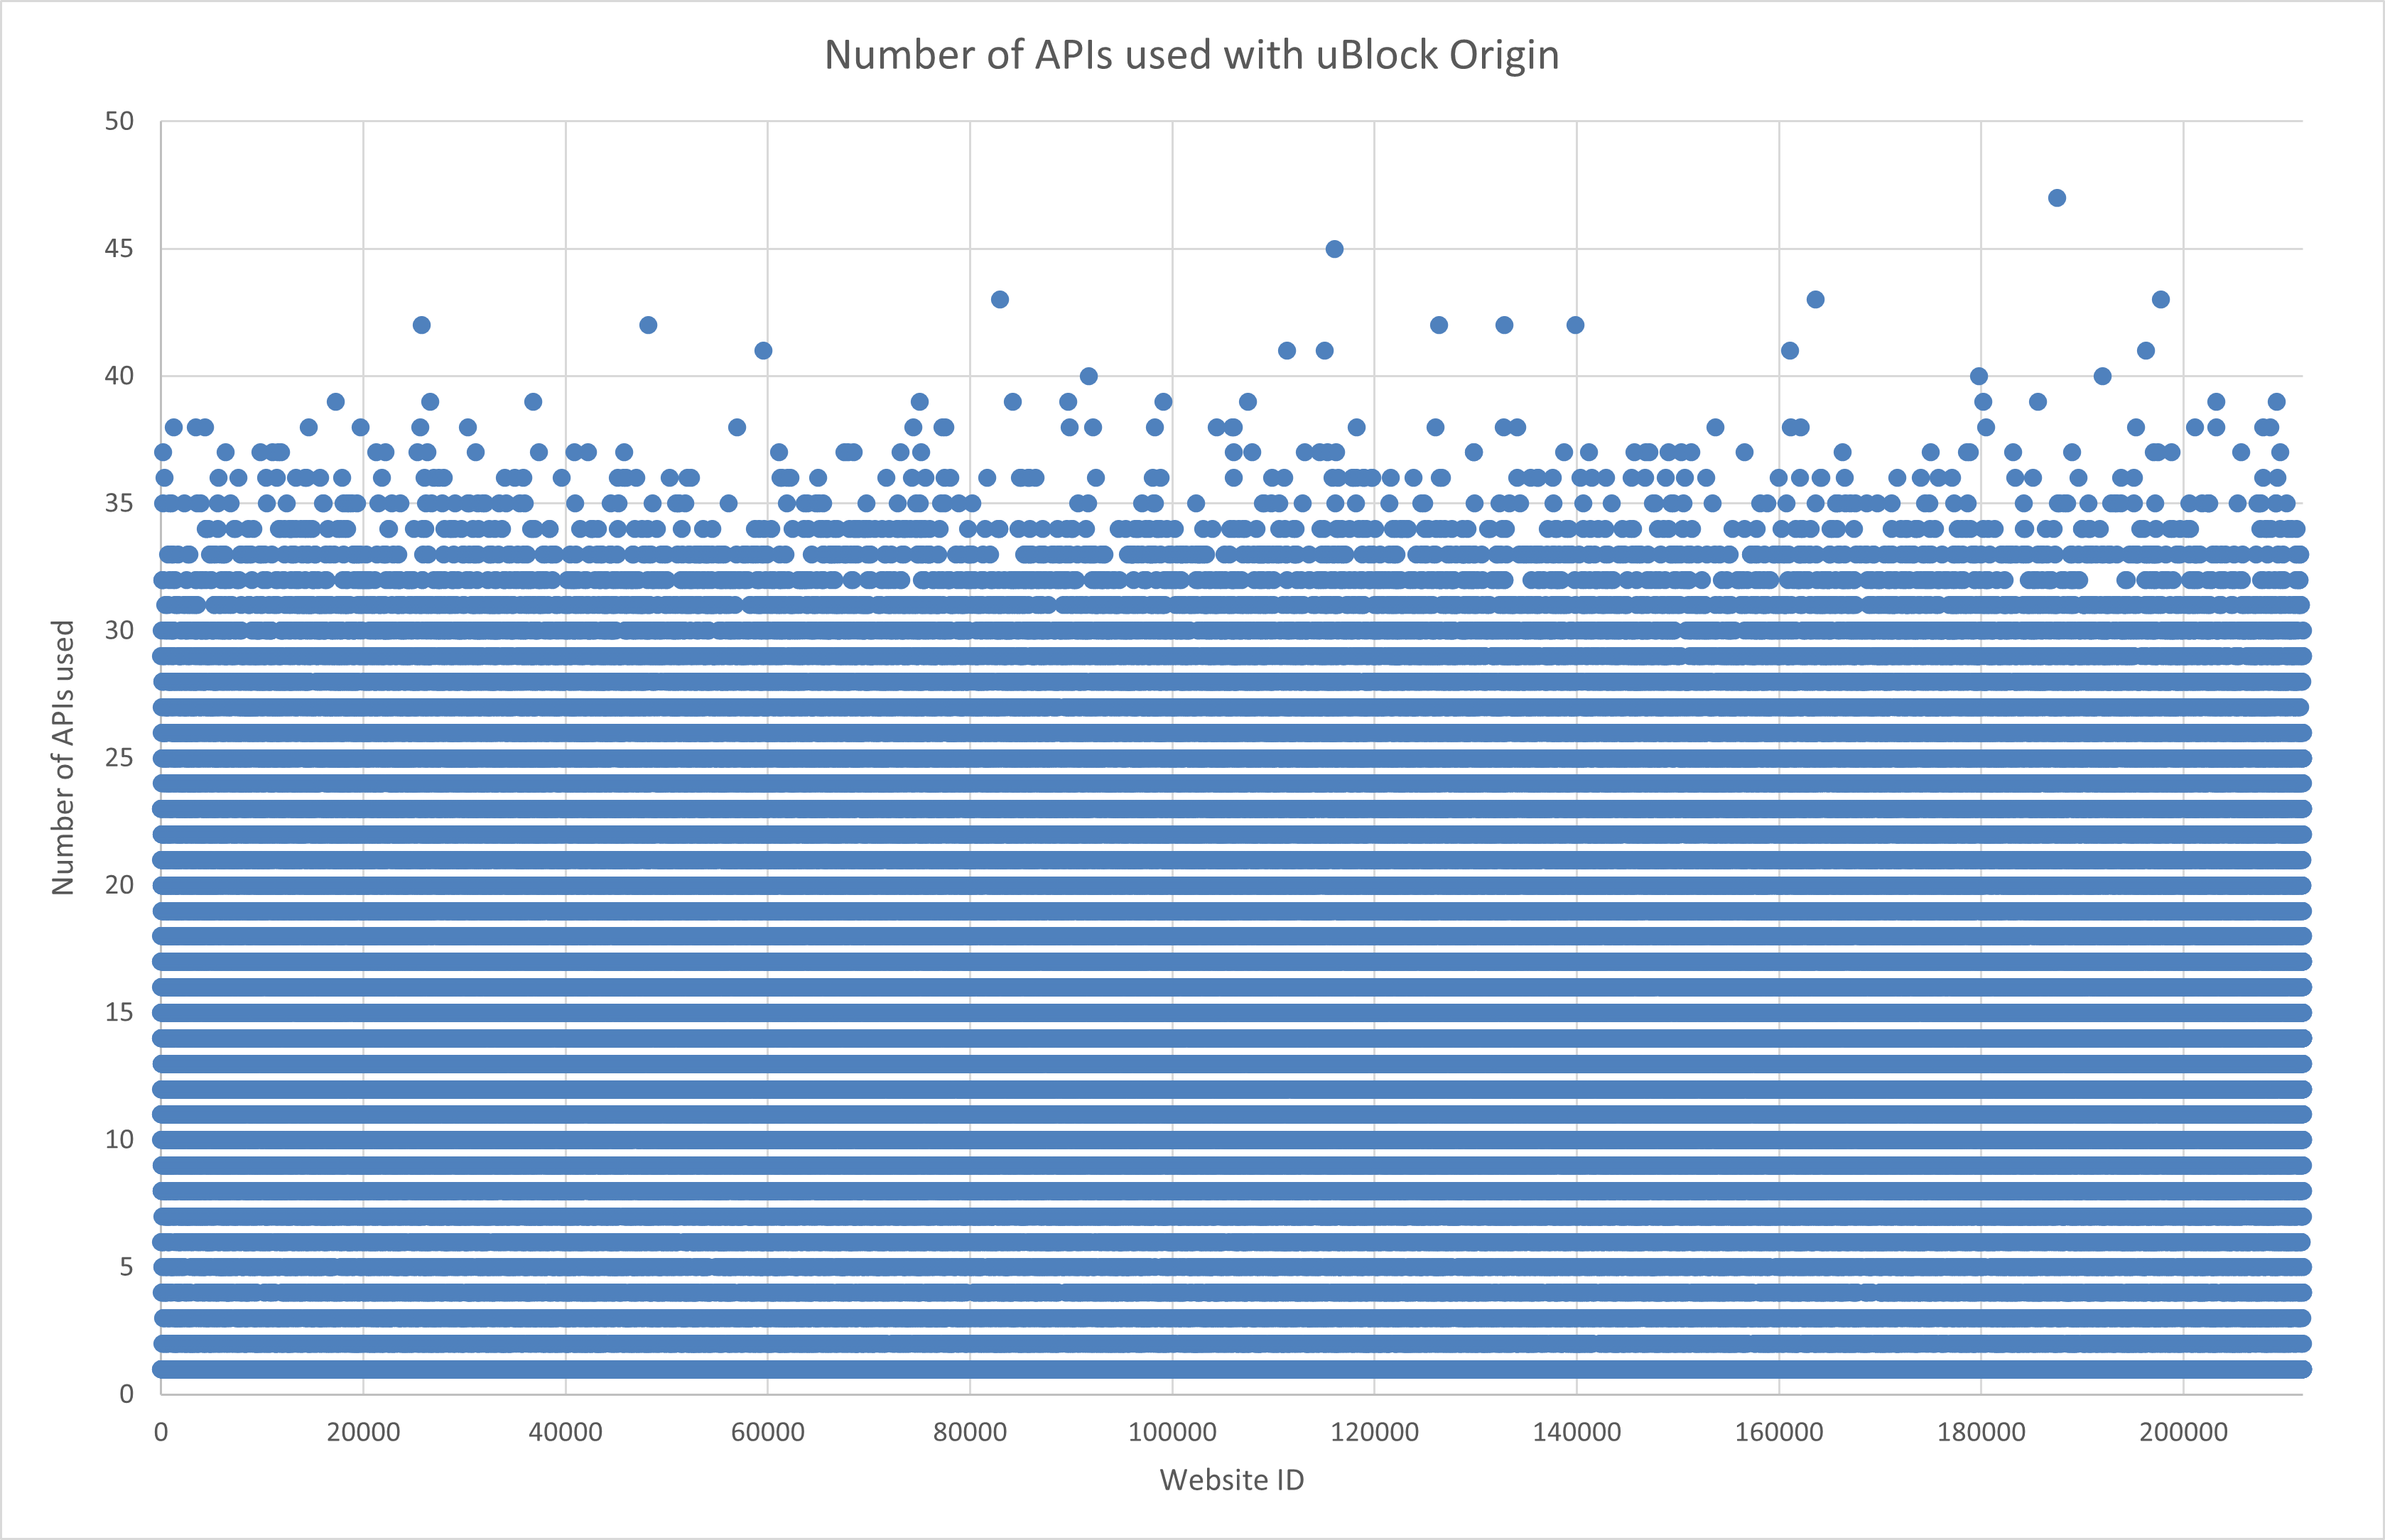
The number of APIs used by the website
Average value - Number of APIs used without uBlock Origin: 18.78
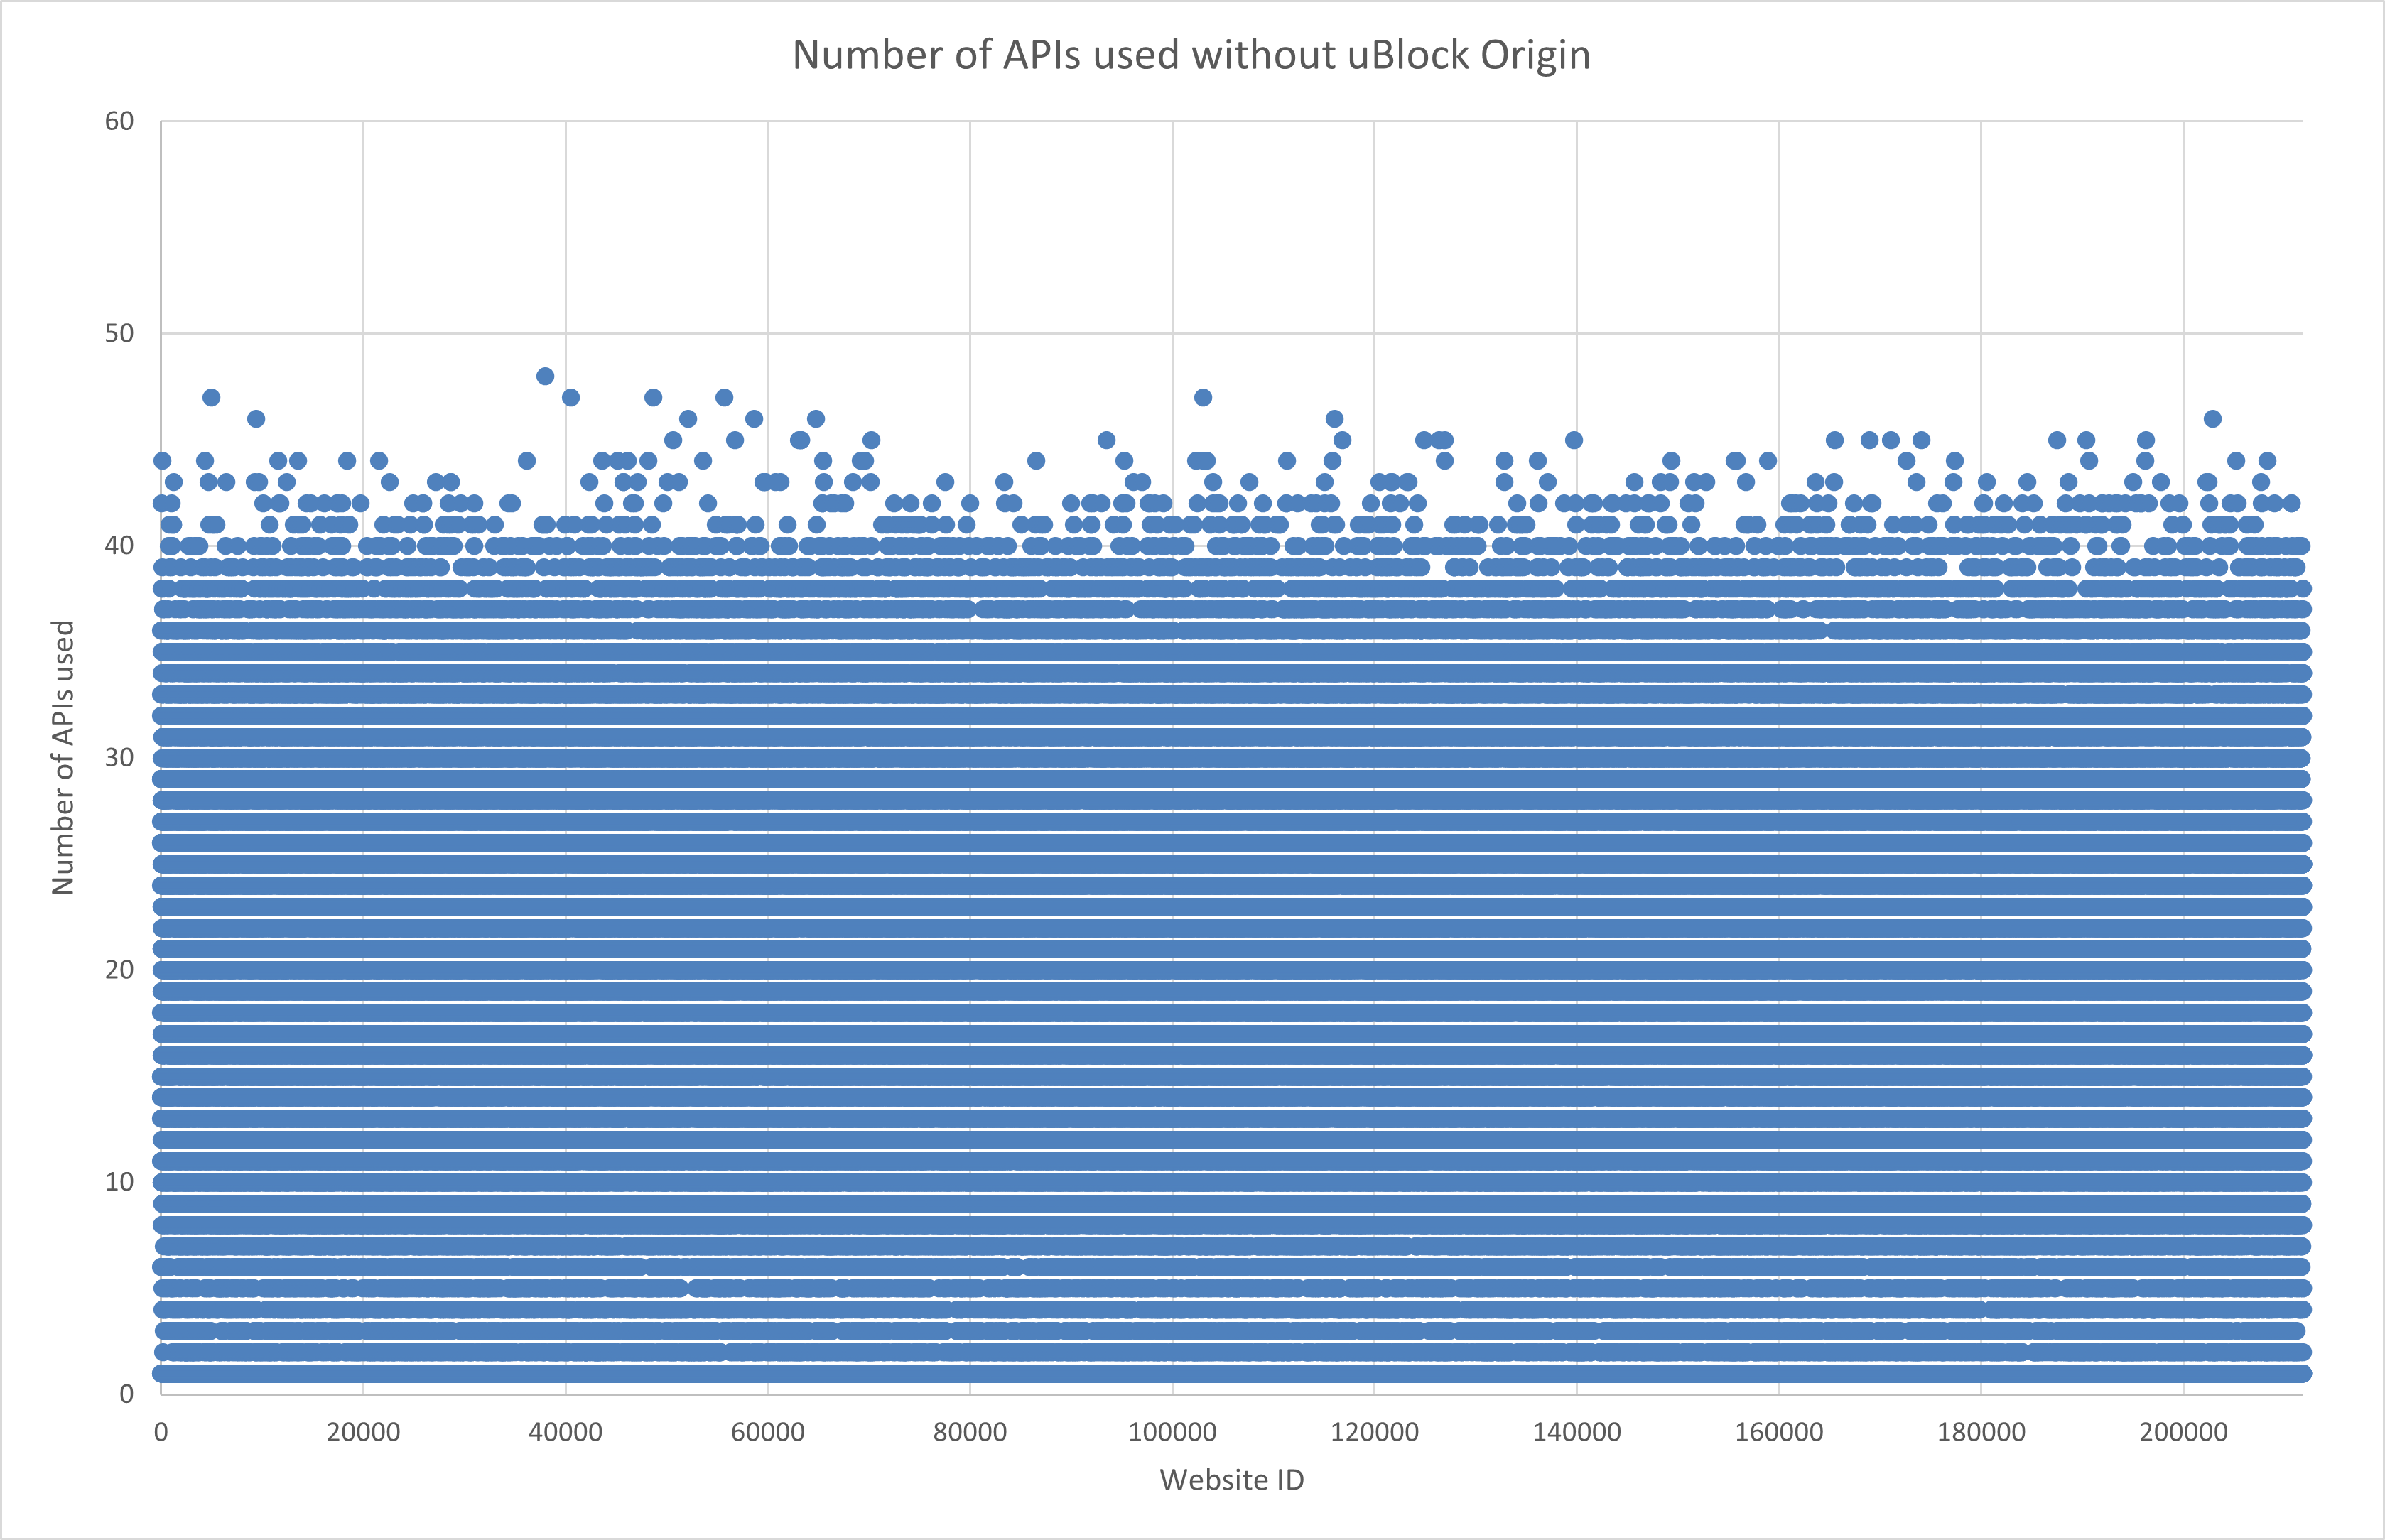
Average value - Number of APIs used with uBlock Origin: 14.27
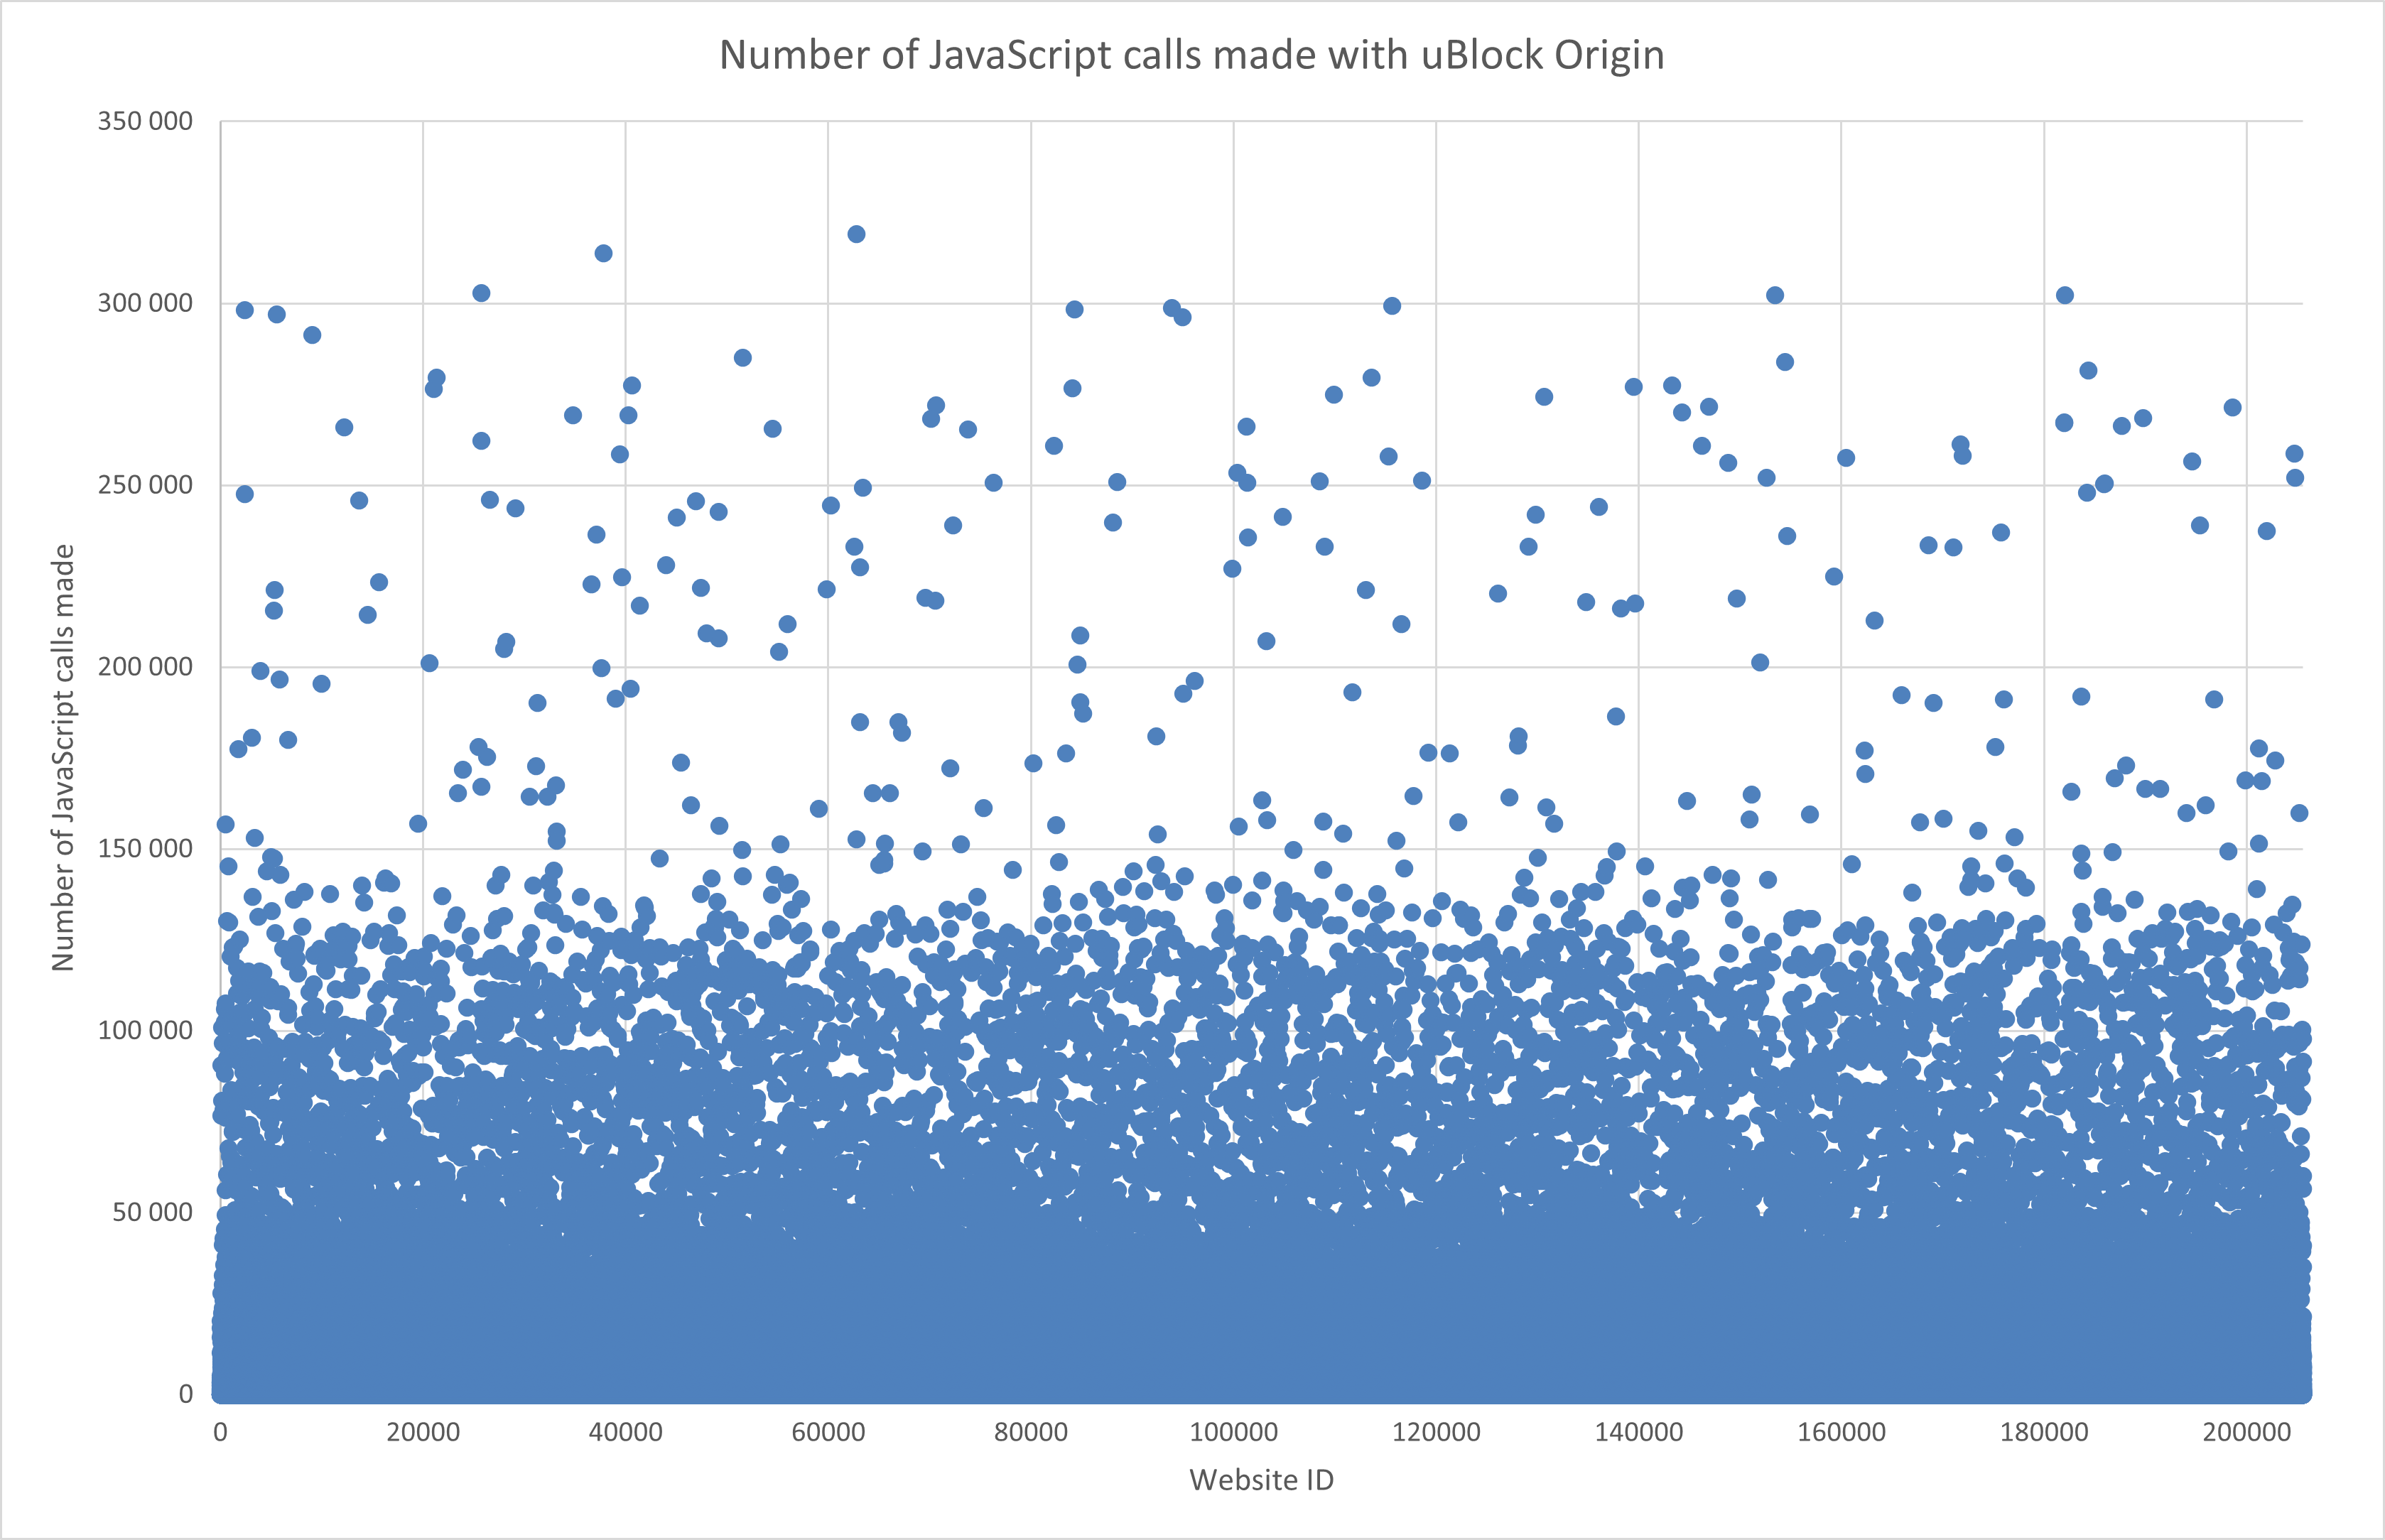
The number of JavaScript calls on websites
Average value - Number of JavaScript calls made without uBlock Origin: 10 629.92
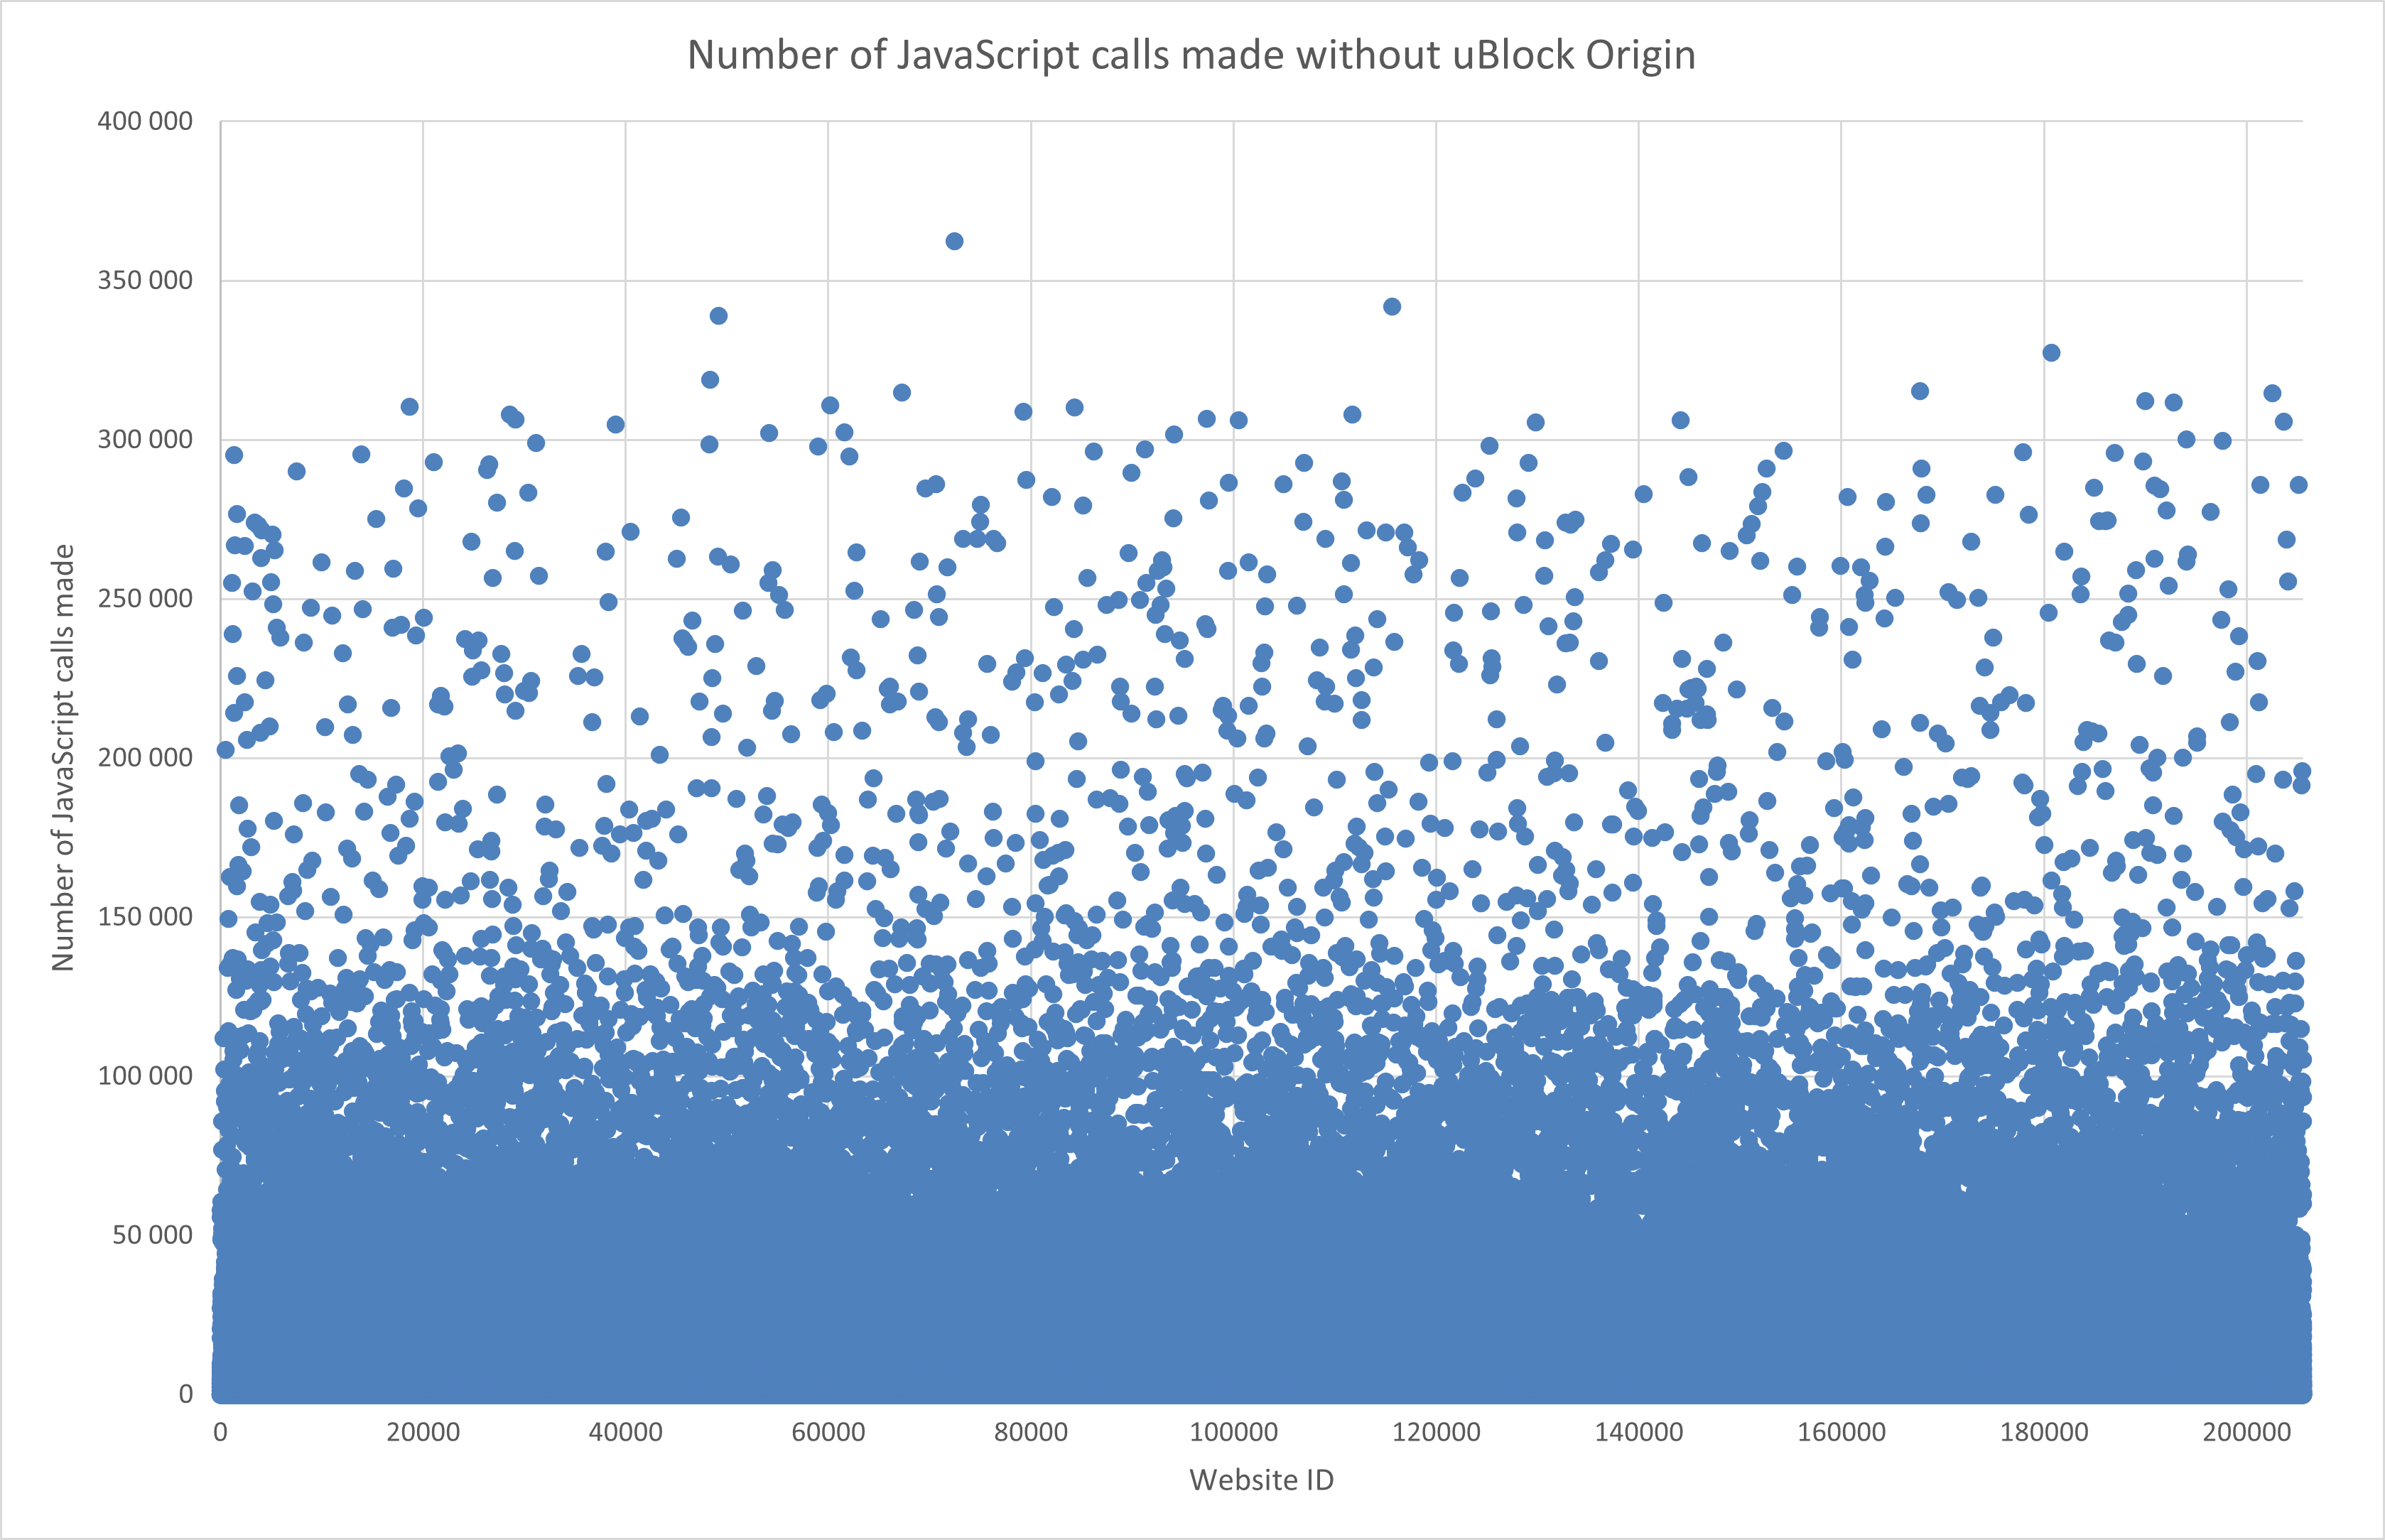
Average value - Number of JavaScript calls made with uBlock Origin: 7 176.2
The number of endpoint calls on websites
| Website | Endpoint | Calls without uBlock | Calls with uBlock | Difference | Difference [%] |
|---|---|---|---|---|---|
| https://www.woolworths.co.za/ | window.getComputedStyle | 202 013 | 1 | 202 012 | 100,00% |
| https://www.superkopilka.com/ | Performance.prototype.now | 158 034 | 1 | 158 033 | 100,00% |
| https://www.jarir.com/ | DOMTokenList.prototype.contains | 156 917 | 1 | 156 916 | 100,00% |
| https://shm.ru/# | Performance.prototype.now | 153 653 | 1 | 153 652 | 100,00% |
| https://znanium.com/ | Performance.prototype.now | 138 465 | 1 | 138 464 | 100,00% |
| https://www.soliton.az/ | Performance.prototype.now | 137 467 | 1 | 137 466 | 100,00% |
| https://www.lasenza.com/ | DOMTokenList.prototype.contains | 118 945 | 1 | 118 944 | 100,00% |
| https://nethouse.ru/ | Performance.prototype.now | 113 580 | 1 | 113 579 | 100,00% |
| https://boodmo.com/ | Performance.prototype.now | 108 376 | 1 | 108 375 | 100,00% |
| https://fipi.ru/ | Performance.prototype.now | 108 255 | 1 | 108 254 | 100,00% |
| https://belregion.ru/ | Performance.prototype.now | 105 227 | 1 | 105 226 | 100,00% |
| https://tsargrad.tv/ | Performance.prototype.now | 99 445 | 1 | 99 444 | 100,00% |
Measurement results for opensource websites only
As this project focuses on free and open source software, we compared the general results with a list of pages connected to free software or open source.
We collected the list of the home pages from Gentoo repository.
We tried to visit all 5 271 collected websites. 4 528 homepages were successfully visited in both modes, with and without uBlock Origin. More than 11 000 000 JS calls were intercepted and stored into 2 SQLite databases that have a total size of over 3 GB.
Only the first 10 lines of the analysis results are usually listed below. Complete tables with all rows can be found in the results stored on the server.
The most blocked API
| API | Calls without uBlock | Calls with uBlock | Difference | Difference [%] |
|---|---|---|---|---|
| Resource Timing Level 2 | 348 | 8 | 340 | 97,70% |
| Non-Standard | 1 711 | 66 | 1 645 | 96,14% |
| Background Tasks API | 18 763 | 1 037 | 17 726 | 94,47% |
| Web Speech API | 306 | 18 | 288 | 94,12% |
| HTML: Plugins | 13 | 2 | 11 | 84,62% |
| Permissions API | 705 | 186 | 519 | 73,62% |
| Performance Timeline | 3 981 | 1 088 | 2 893 | 72,67% |
| High Resolution Time (Level 2) | 849 390 | 232 806 | 616 584 | 72,59% |
| Navigation Timing | 21 | 6 | 15 | 71,43% |
| Performance Timeline (Level 2) | 2 548 | 745 | 1 803 | 70,76% |
| Storage API | 3 | 1 | 2 | 66,67% |
| Beacon | 727 | 250 | 477 | 65,61% |
| Web Cryptography API | 7 632 | 2 928 | 4 704 | 61,64% |
The most blocked API endpoints
| Endpoint | API | Calls without uBlock | Calls with uBlock | Difference | Difference [%] |
|---|---|---|---|---|---|
| IdleDeadline.prototype.timeRemaining | Background Tasks API | 2 258 | 2 | 2 256 | 99,91% |
| Element.prototype.getAttributeNames | DOM | 1 648 | 12 | 1 636 | 99,27% |
| MessagePort.prototype.close | HTML: Channel Messaging | 268 | 2 | 266 | 99,25% |
| Document.prototype.elementFromPoint | CSS Object Model (CSSOM) | 2 554 | 22 | 2 532 | 99,14% |
| Range.prototype.selectNode | DOM Level 2: Traversal and Range | 106 | 1 | 105 | 99,06% |
| CanvasRenderingContext2D.prototype.createLinearGradient | HTML: Canvas Element | 4 634 | 56 | 4 578 | 98,79% |
| CanvasRenderingContext2D.prototype.transform | HTML: Canvas Element | 37 792 | 845 | 36 947 | 97,76% |
| PerformanceResourceTiming.prototype.toJSON | Resource Timing Level 2 | 348 | 8 | 340 | 97,70% |
| Navigator.prototype.javaEnabled | Non-Standard | 1 691 | 47 | 1 644 | 97,22% |
| PerformanceObserverEntryList.prototype.getEntriesByName | Performance Timeline (Level 2) | 52 | 2 | 50 | 96,15% |
| CanvasGradient.prototype.addColorStop | HTML: Canvas Element | 9 623 | 453 | 9 170 | 95,29% |
Use of APIs on websites
| API | Websites without uBlock [%] | Websites with uBlock [%] | Difference [%] |
|---|---|---|---|
| Non-Standard | 26,47% | 1,13% | 25,26% |
| Web Cryptography API | 21,94% | 7,24% | 14,64% |
| XMLHttpRequest | 26,42% | 14,94% | 11,41% |
| HTML 5 | 13,70% | 9,08% | 4,58% |
| Beacon | 6,35% | 1,76% | 4,58% |
| Performance Timeline | 10,07% | 5,68% | 4,36% |
| High Resolution Time (Level 2) | 15,46% | 11,12% | 4,29% |
| HTML: Channel Messaging | 10,79% | 6,46% | 4,29% |
| HTML: Web Storage | 20,60% | 16,26% | 4,27% |
The number of APIs used by the website
Average value - Number of APIs used without uBlock Origin: 7.4

Average value - Number of APIs used with uBlock Origin: 6.2

The number of JavaScript calls on websites
Average value - Number of JavaScript calls made without uBlock Origin: 1598.18

Average value - Number of JavaScript calls made with uBlock Origin: 1304.06

The number of endpoint calls on websites
| Website | Endpoint | Calls without uBlock | Calls with uBlock | Difference | Difference [%] |
|---|---|---|---|---|---|
| https://wci.llnl.gov/ | Element.prototype.hasAttribute | 34 860 | 1 | 34 859 | 100,00% |
| https://wiibrew.org/wiki/Main_Page | Performance.prototype.now | 6 512 | 1 | 6 511 | 99,98% |
| http://www.vsound.org/ | Document.prototype.getElementById | 5 797 | 1 | 5 796 | 99,98% |
| http://wormsofprey.org/ | Document.prototype.getElementById | 5 793 | 1 | 5 792 | 99,98% |
| http://konst.org.ua/ | Element.prototype.setAttribute | 4 248 | 1 | 4 247 | 99,98% |
| https://www.union.edu/mathematics | Performance.prototype.now | 5 317 | 2 | 5 315 | 99,96% |
| https://www.mongodb.com/ | window.getComputedStyle | 30 516 | 14 | 30 502 | 99,95% |
| https://www.monotype.com/ | Performance.prototype.now | 4 091 | 2 | 4 089 | 99,95% |
| https://sylabs.io/ | Performance.prototype.now | 1 839 | 1 | 1 838 | 99,95% |
| http://vlgothic.dicey.org/ | Performance.prototype.now | 3 427 | 2 | 3 425 | 99,94% |
| https://www.ppsspp.org/ | Performance.prototype.now | 3 397 | 2 | 3 395 | 99,94% |
Measurement results for FingerPrint Detector
We designed the web crawling primarily to retrieve data to create or evaluate heuristics for the FingerPrint Detector (FPD). The above results are helpful in understanding the JavaScript APIs usage on the web. For FPD, only the name of the endpoint and the weight of this endpoint are important. The weight expresses how often a given endpoint is used to create a fingerprint.
The resulting table below was created from crawled data from websites of the Tranco list . Two data sets were combined to obtain more accurate results. The first dataset obtained while crawling with uBlock Origin, the second one obtained while crawling with uMatrix.
The resulting endpoint weight (marked as average_weight) was calculated in Python as follows:
weight_uMatrix = max(0, 10 + ((10-len(str(calls)))/2) - ((100-(100*difference_uMatrix_percent))/3) )
weight_uBlock = max(0, 10 + ((10-len(str(calls)))/2) - ((100-(100*difference_uBlock_percent))/3) )

if weight_uMatrix > 0 and weight_uBlock > 0:
    average_weight = round((weight_uMatrix + weight_uBlock)/2)
else:
    average_weight = 0
Again, only the first 10 lines of the FPD analysis result are listed below. Complete table with all rows can be found in the results stored on the server.
| Endpoint | Average weight | uMatrix weight | uBlock weight | Calls without extension | Calls with uMatrix | Calls with uBlock | Difference uMatrix | Difference uBlock | Difference uMatrix [%] | Difference uBlock [%] |
|---|---|---|---|---|---|---|---|---|---|---|
| Range.prototype.setStartAfter | 13 | 13,427 | 13,060 | 455 | 1 | 6 | 454 | 449 | 0,998 | 0,987 |
| Range.prototype.insertNode | 13 | 13,138 | 12,920 | 460 | 5 | 8 | 455 | 452 | 0,989 | 0,983 |
| HTMLFormControlsCollection.prototype.namedItem | 13 | 12,714 | 12,623 | 2 211 | 19 | 25 | 2 192 | 2 186 | 0,991 | 0,989 |
| Document.prototype.open | 12 | 12,475 | 11,274 | 8 190 | 129 | 424 | 8 061 | 7 766 | 0,984 | 0,948 |
| MessagePort.prototype.close | 12 | 12,438 | 12,424 | 16 208 | 30 | 37 | 16 178 | 16 171 | 0,998 | 0,998 |
| Document.prototype.getElementsByTagNameNS | 12 | 12,374 | 10,811 | 533 | 18 | 43 | 515 | 490 | 0,966 | 0,919 |
| Document.prototype.close | 12 | 12,086 | 11,944 | 7 731 | 212 | 245 | 7 519 | 7 486 | 0,973 | 0,968 |
| SubtleCrypto.prototype.generateKey | 12 | 11,876 | 11,503 | 985 | 48 | 59 | 937 | 926 | 0,951 | 0,940 |
| Document.prototype.elementsFromPoint | 12 | 12,469 | 11,365 | 46 938 | 44 | 1 598 | 46 894 | 45 340 | 0,999 | 0,966 |
| Navigator.prototype.javaEnabled | 11 | 10,892 | 10,892 | 110 665 | 3 677 | 3 679 | 106 988 | 106 986 | 0,967 | 0,967 |
More about FingerPrint Detector is written in the following blogpost.
Conclusion
The crawl identified JavaScript endpoints, often used to create a browser fingerprint. The observed data allow assigning weights for each endpoint. FingerPrint Detector configuration file uses the crawl results.